Fulcrum Analytics

Creation of campaign report infographics and a year-end holiday graphic card to support data-driven storytelling at Fulcrum Analytics

2021

Data VisualizationInformation DesignVisual CommunicationContent Strategy
I. CAMPAIGN REPORT INFOGRAPHICS

OVERVIEW

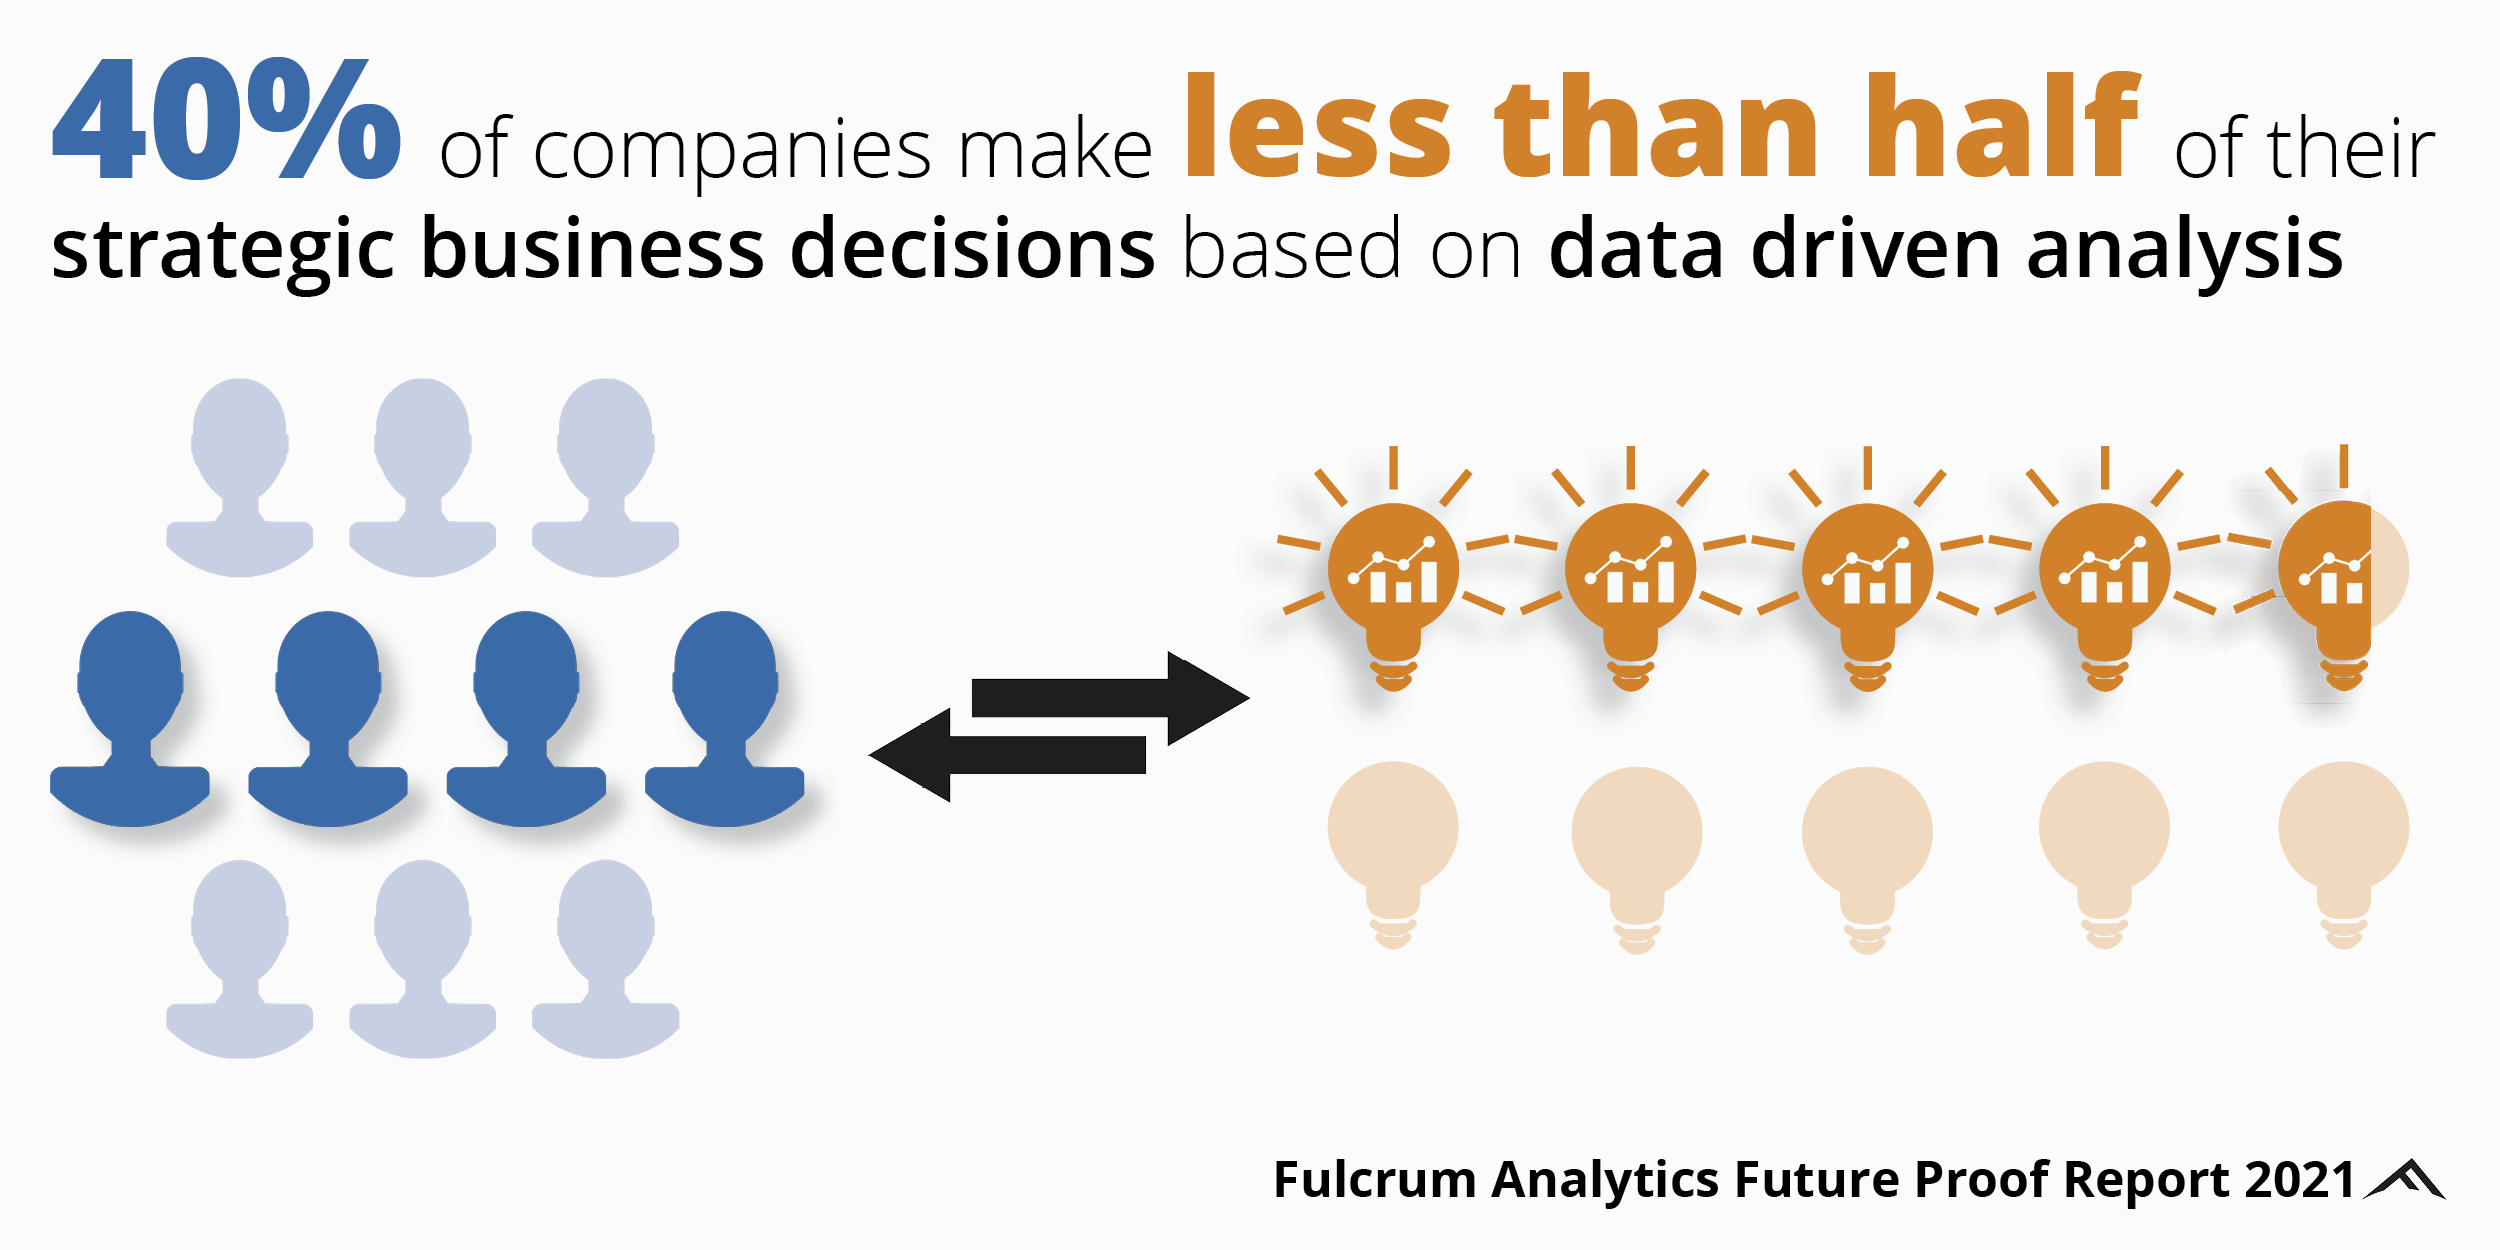
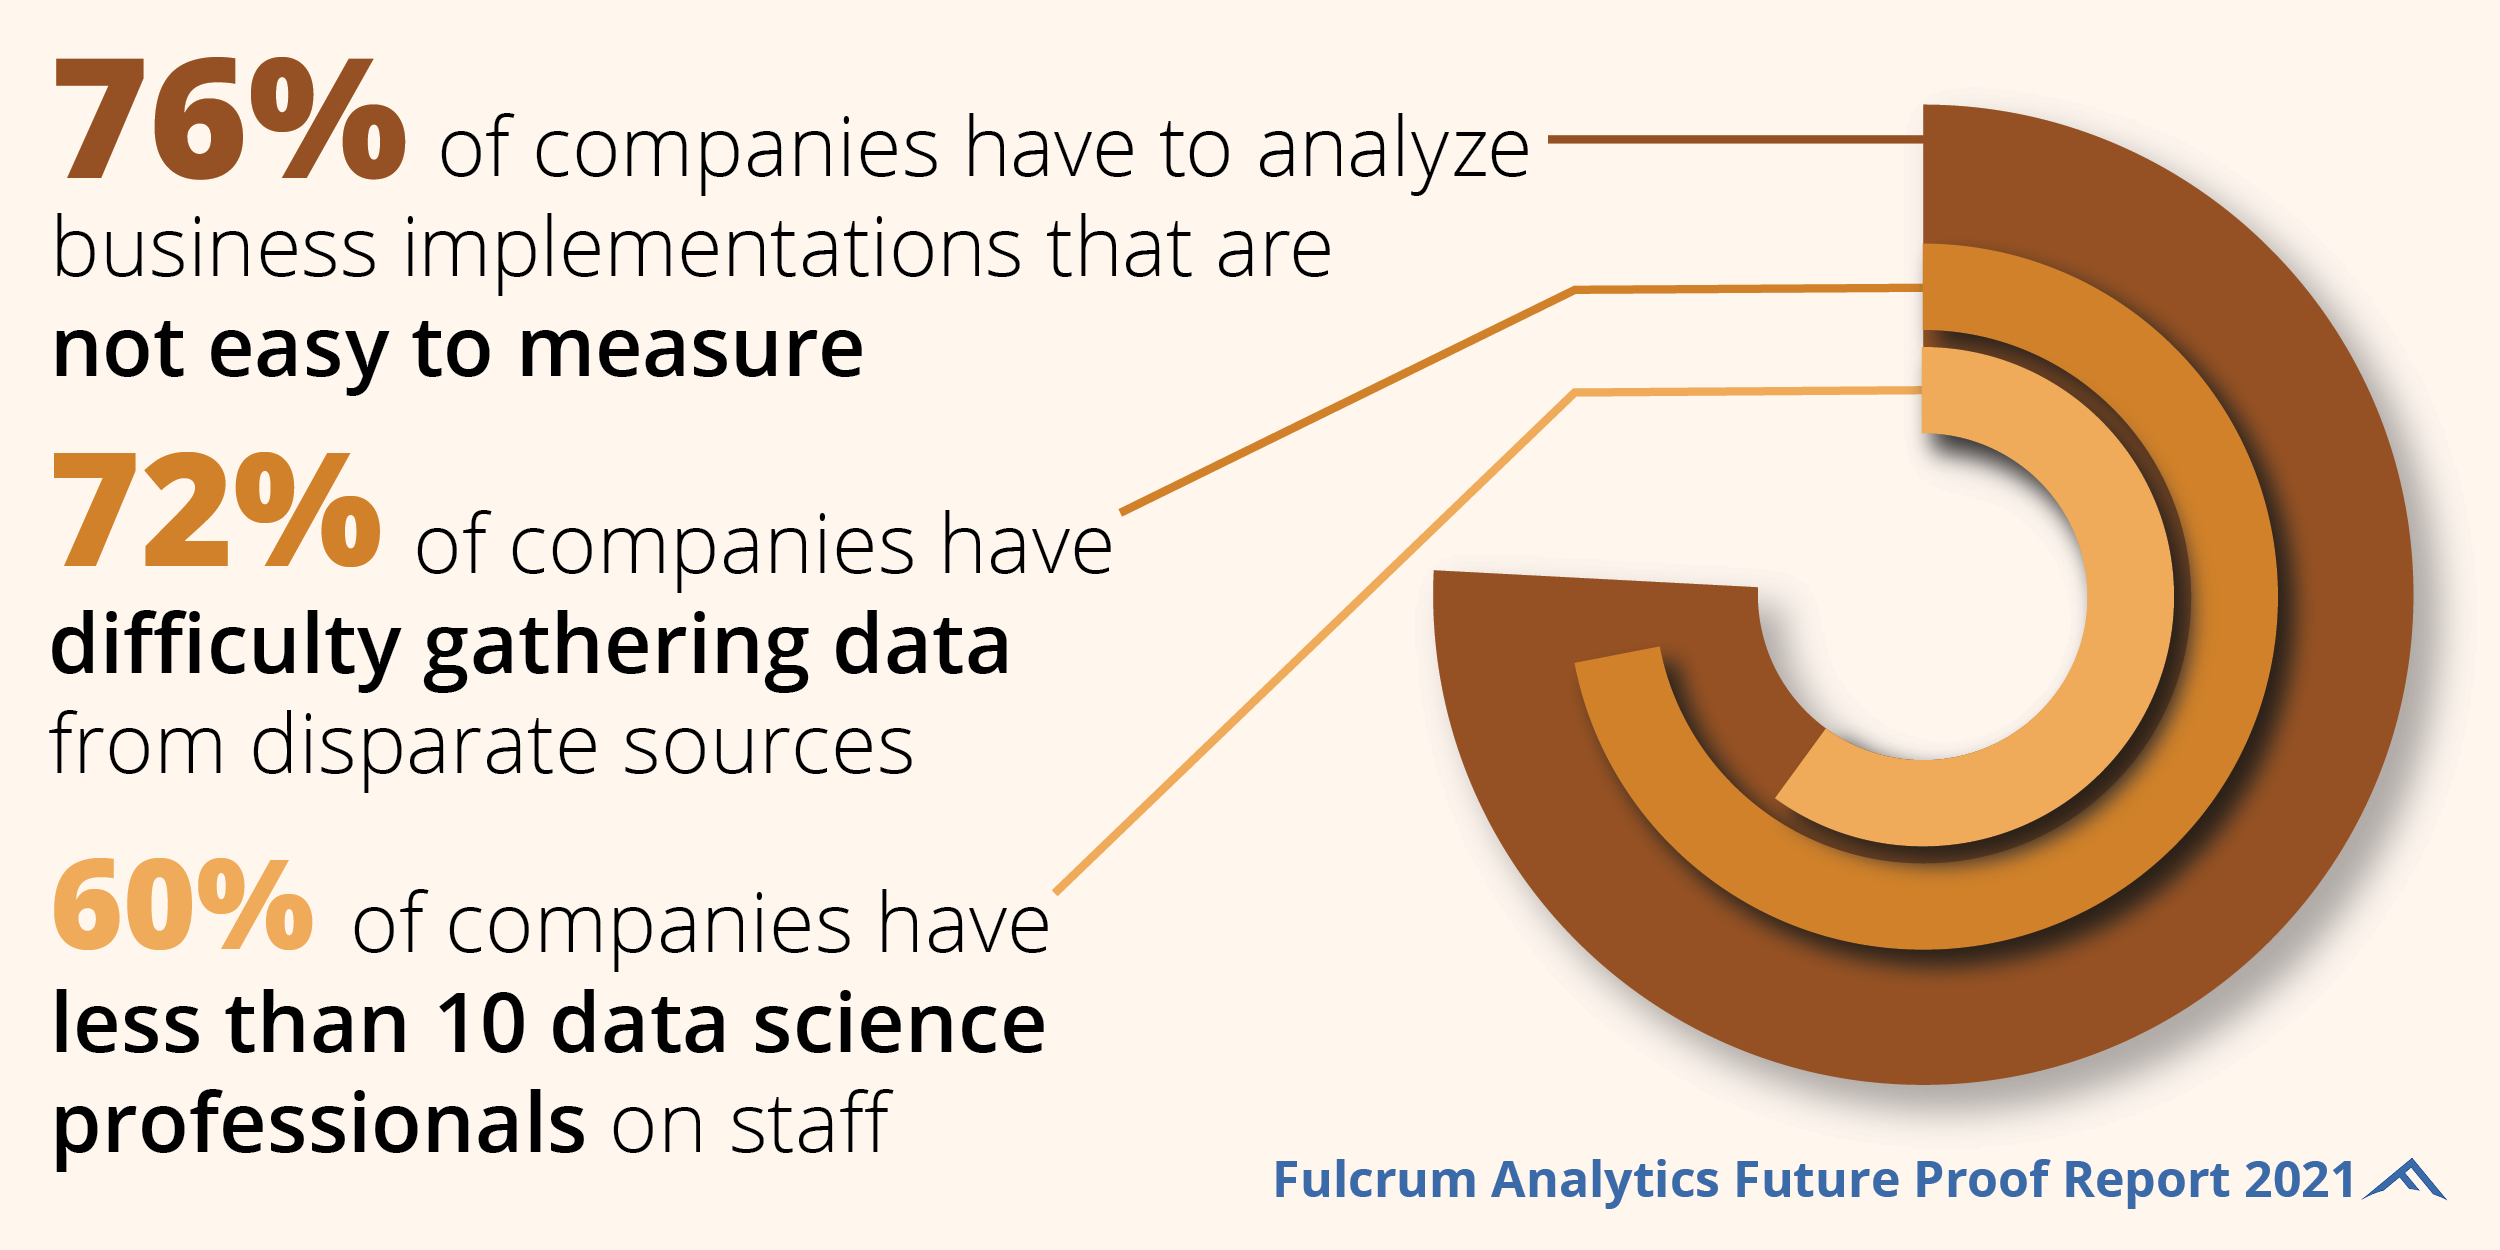
A series of concise, data-driven infographics designed for executive-level reporting. Visual hierarchy emphasizes outcomes first, followed by key drivers and supporting metrics. Assets delivered for web and PDF.

DELIVERABLES

Campaign infographic panel 1
Campaign infographic panel 2
II. HOLIDAY CARD

CONCEPT

A playful year-end visual celebrating the team’s analytics culture. The card extends brand typography and color; a lightweight motion version was prepared for digital channels.

DELIVERABLES

Fulcrum Analytics holiday card