Fulcrum Analytics
Data Analysis + Data Visualization + Information Design + Graphic Design
Campaign Report Infographics & Branded Marketing Asset at Fulcrum Analytics
2021
Tool | Google Sheets, Data Studio, Adobe Illustrator, InDesign
I. CAMPAIGN REPORT INFOGRAPHICS
A Series of Three Infographics for Fulcrum Analytics LTM Future Proof Report for Online Marketing Outreach
Overview
Raw Survey Data Analysis → Information Design as Thesis, Problem, Solution → Data Visualization → Infographic Design → Online Marketing Outreach
Method
Data Analysis, Data Visualization, Information Design
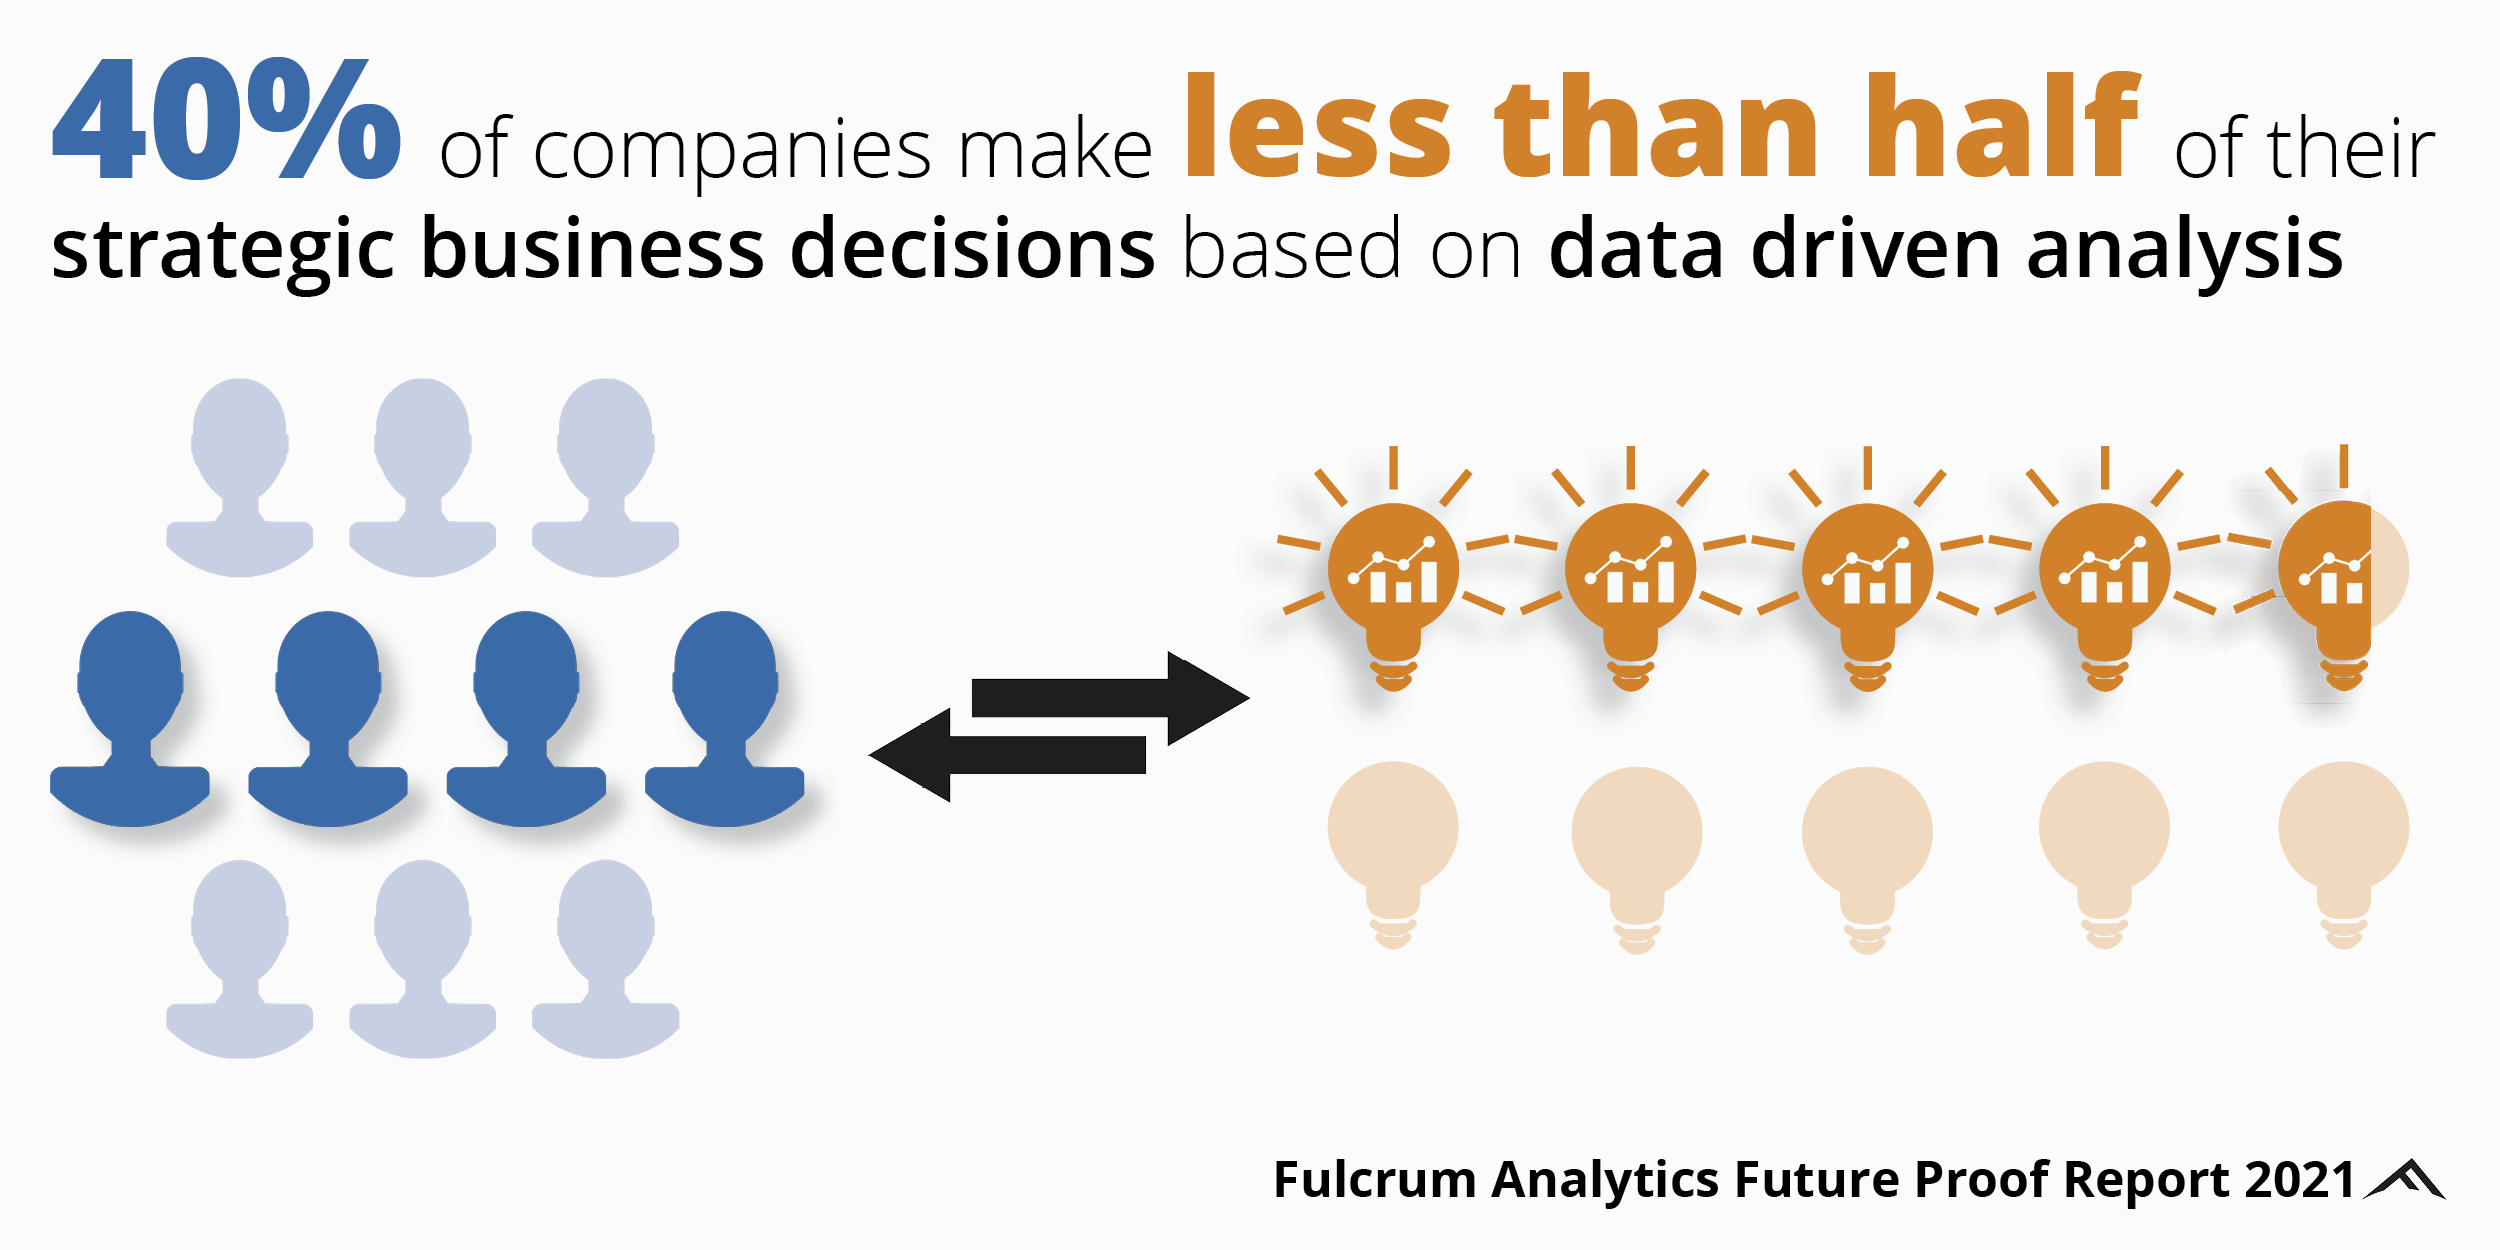
Infographic #1: Thesis

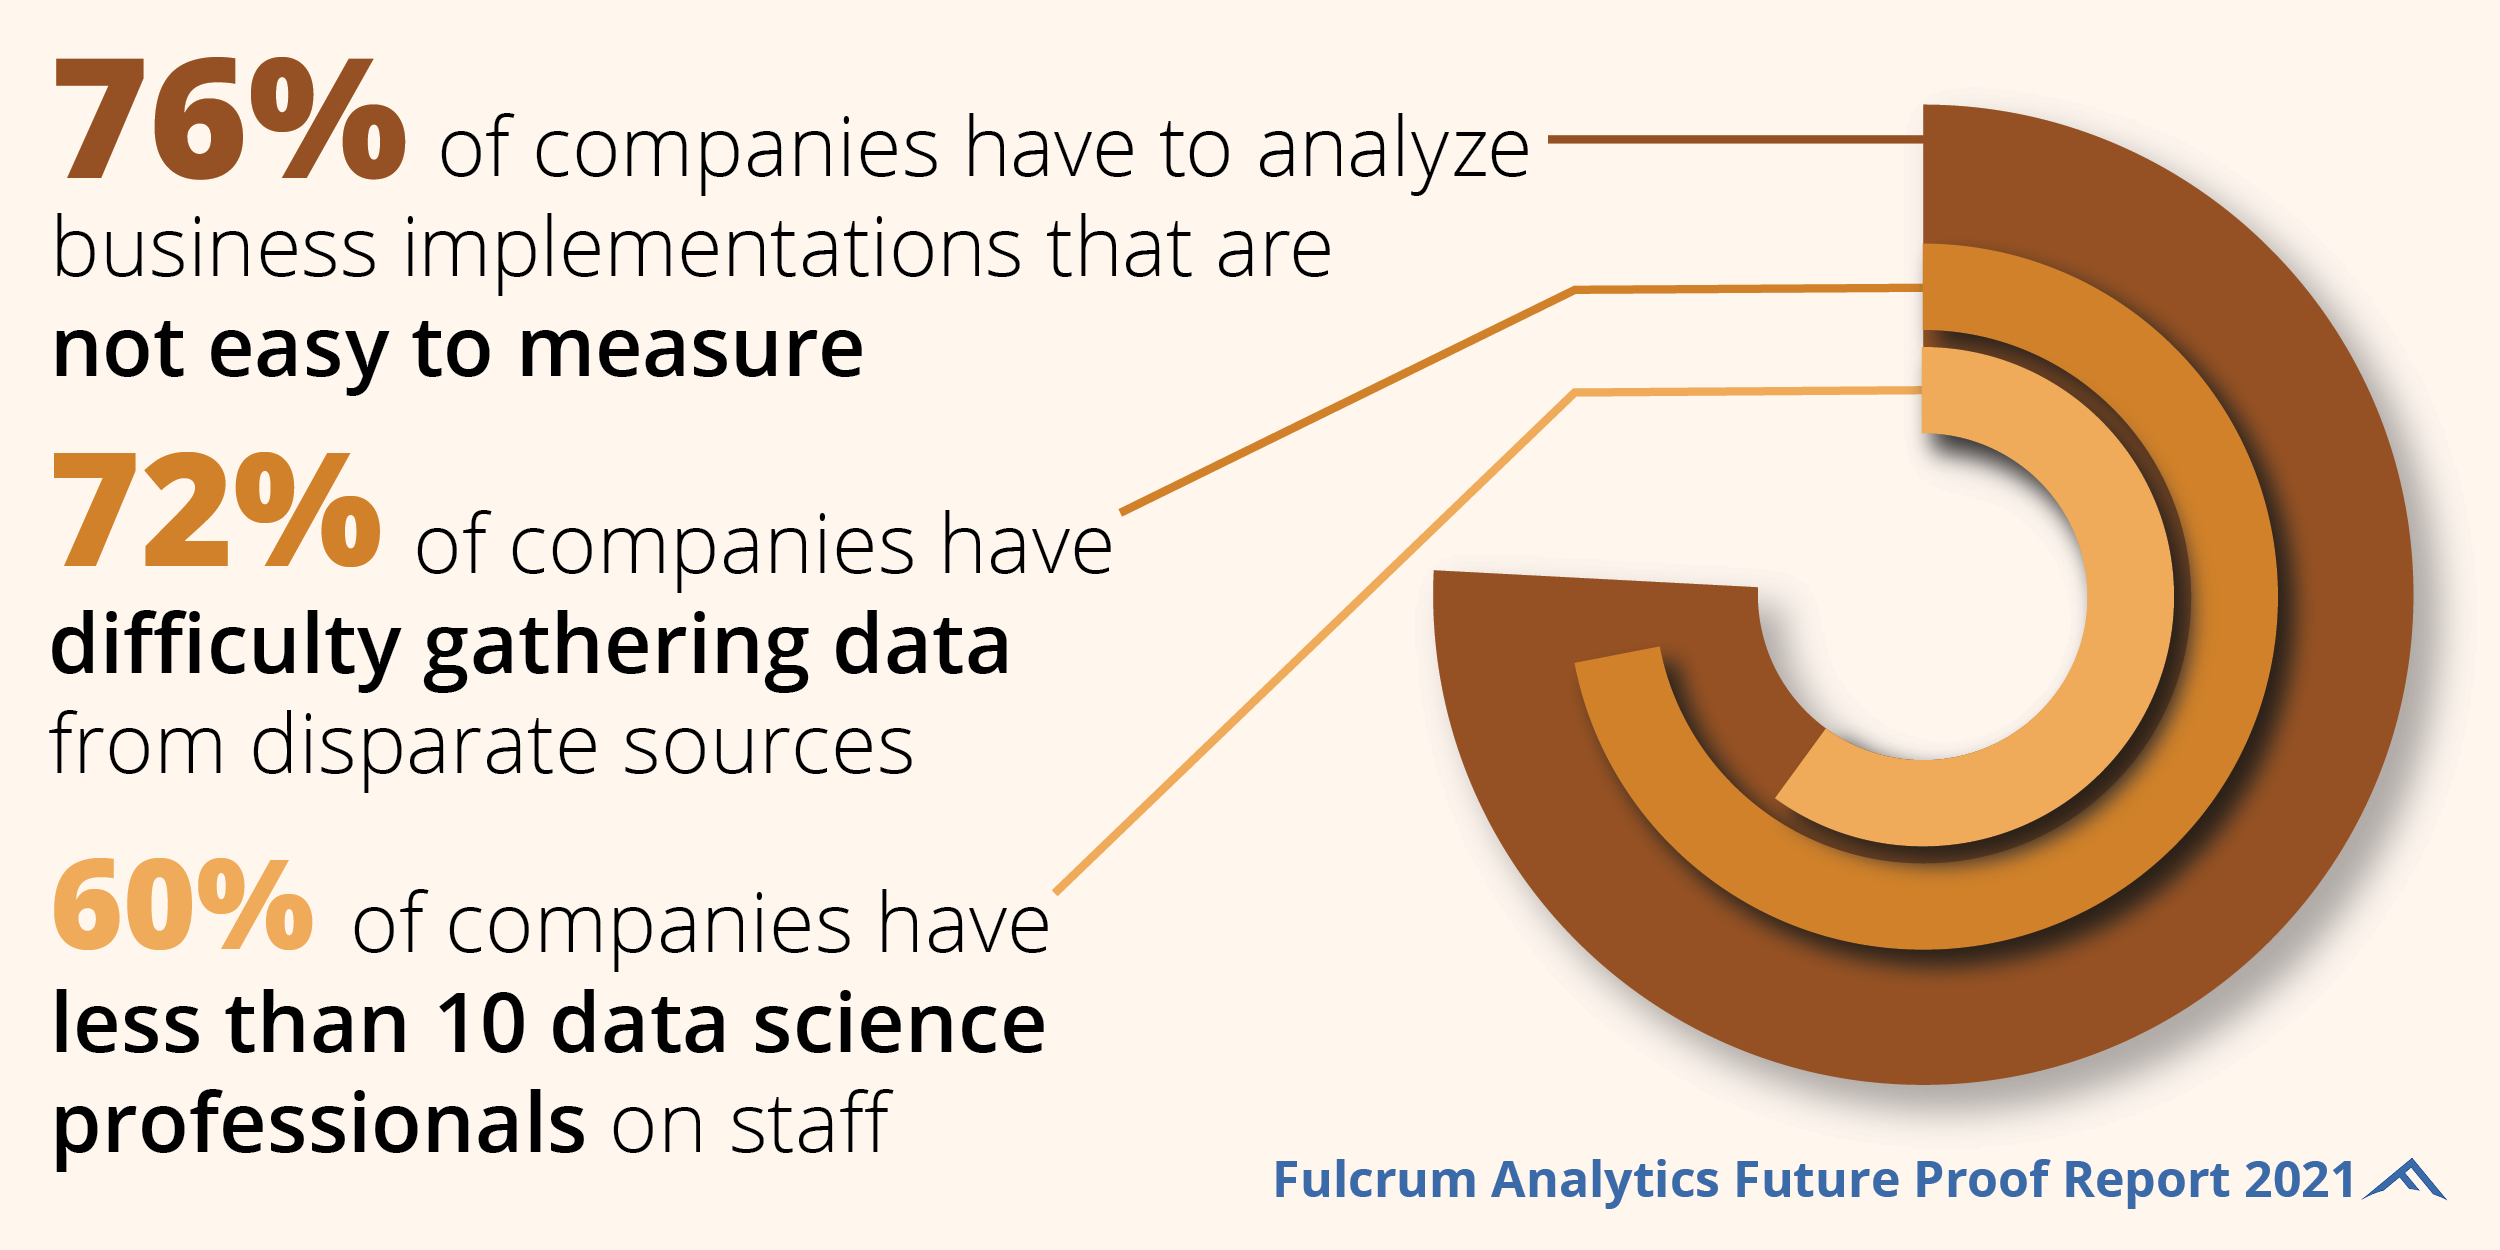
Infographic #2: Problem

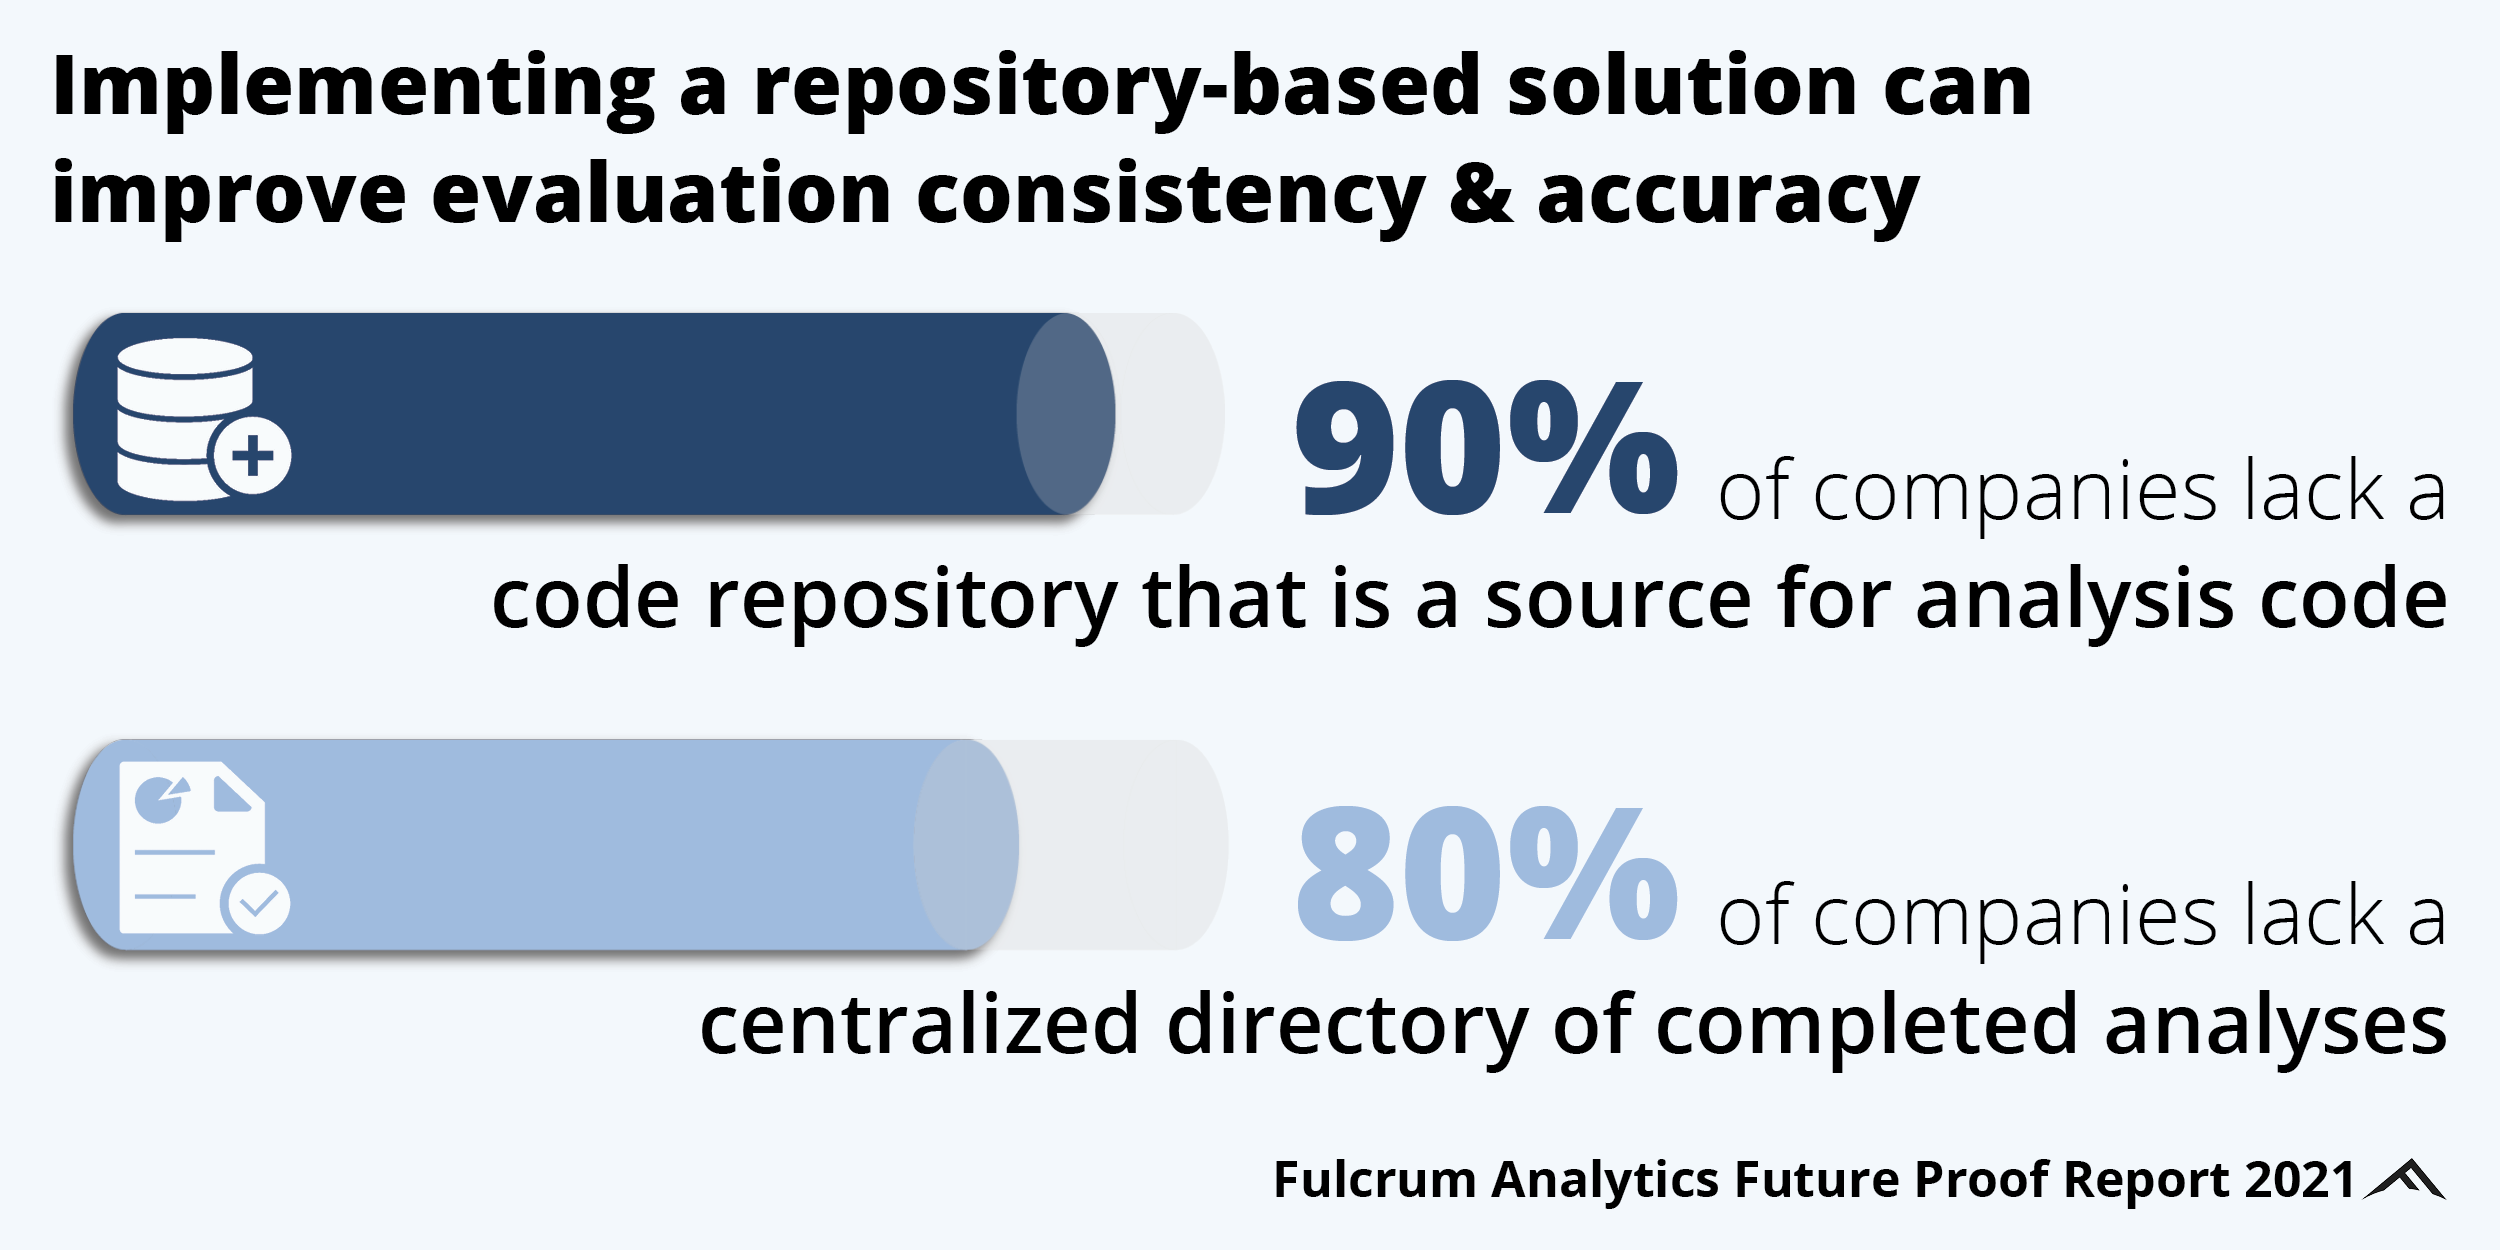
Infographic #3: Solution

Description
To identify key insights, I conducted an analysis of raw survey data. The extracted information was then categorized into three thematic sections: thesis, problems, and solutions. To effectively communicate these findings, I designed data-driven visualizations and corresponding infographics, all presented in a clear three-part structure. This final product served as a valuable asset for Fulcrum's online marketing outreach efforts.
II. BRANDED MARKETING ASSET
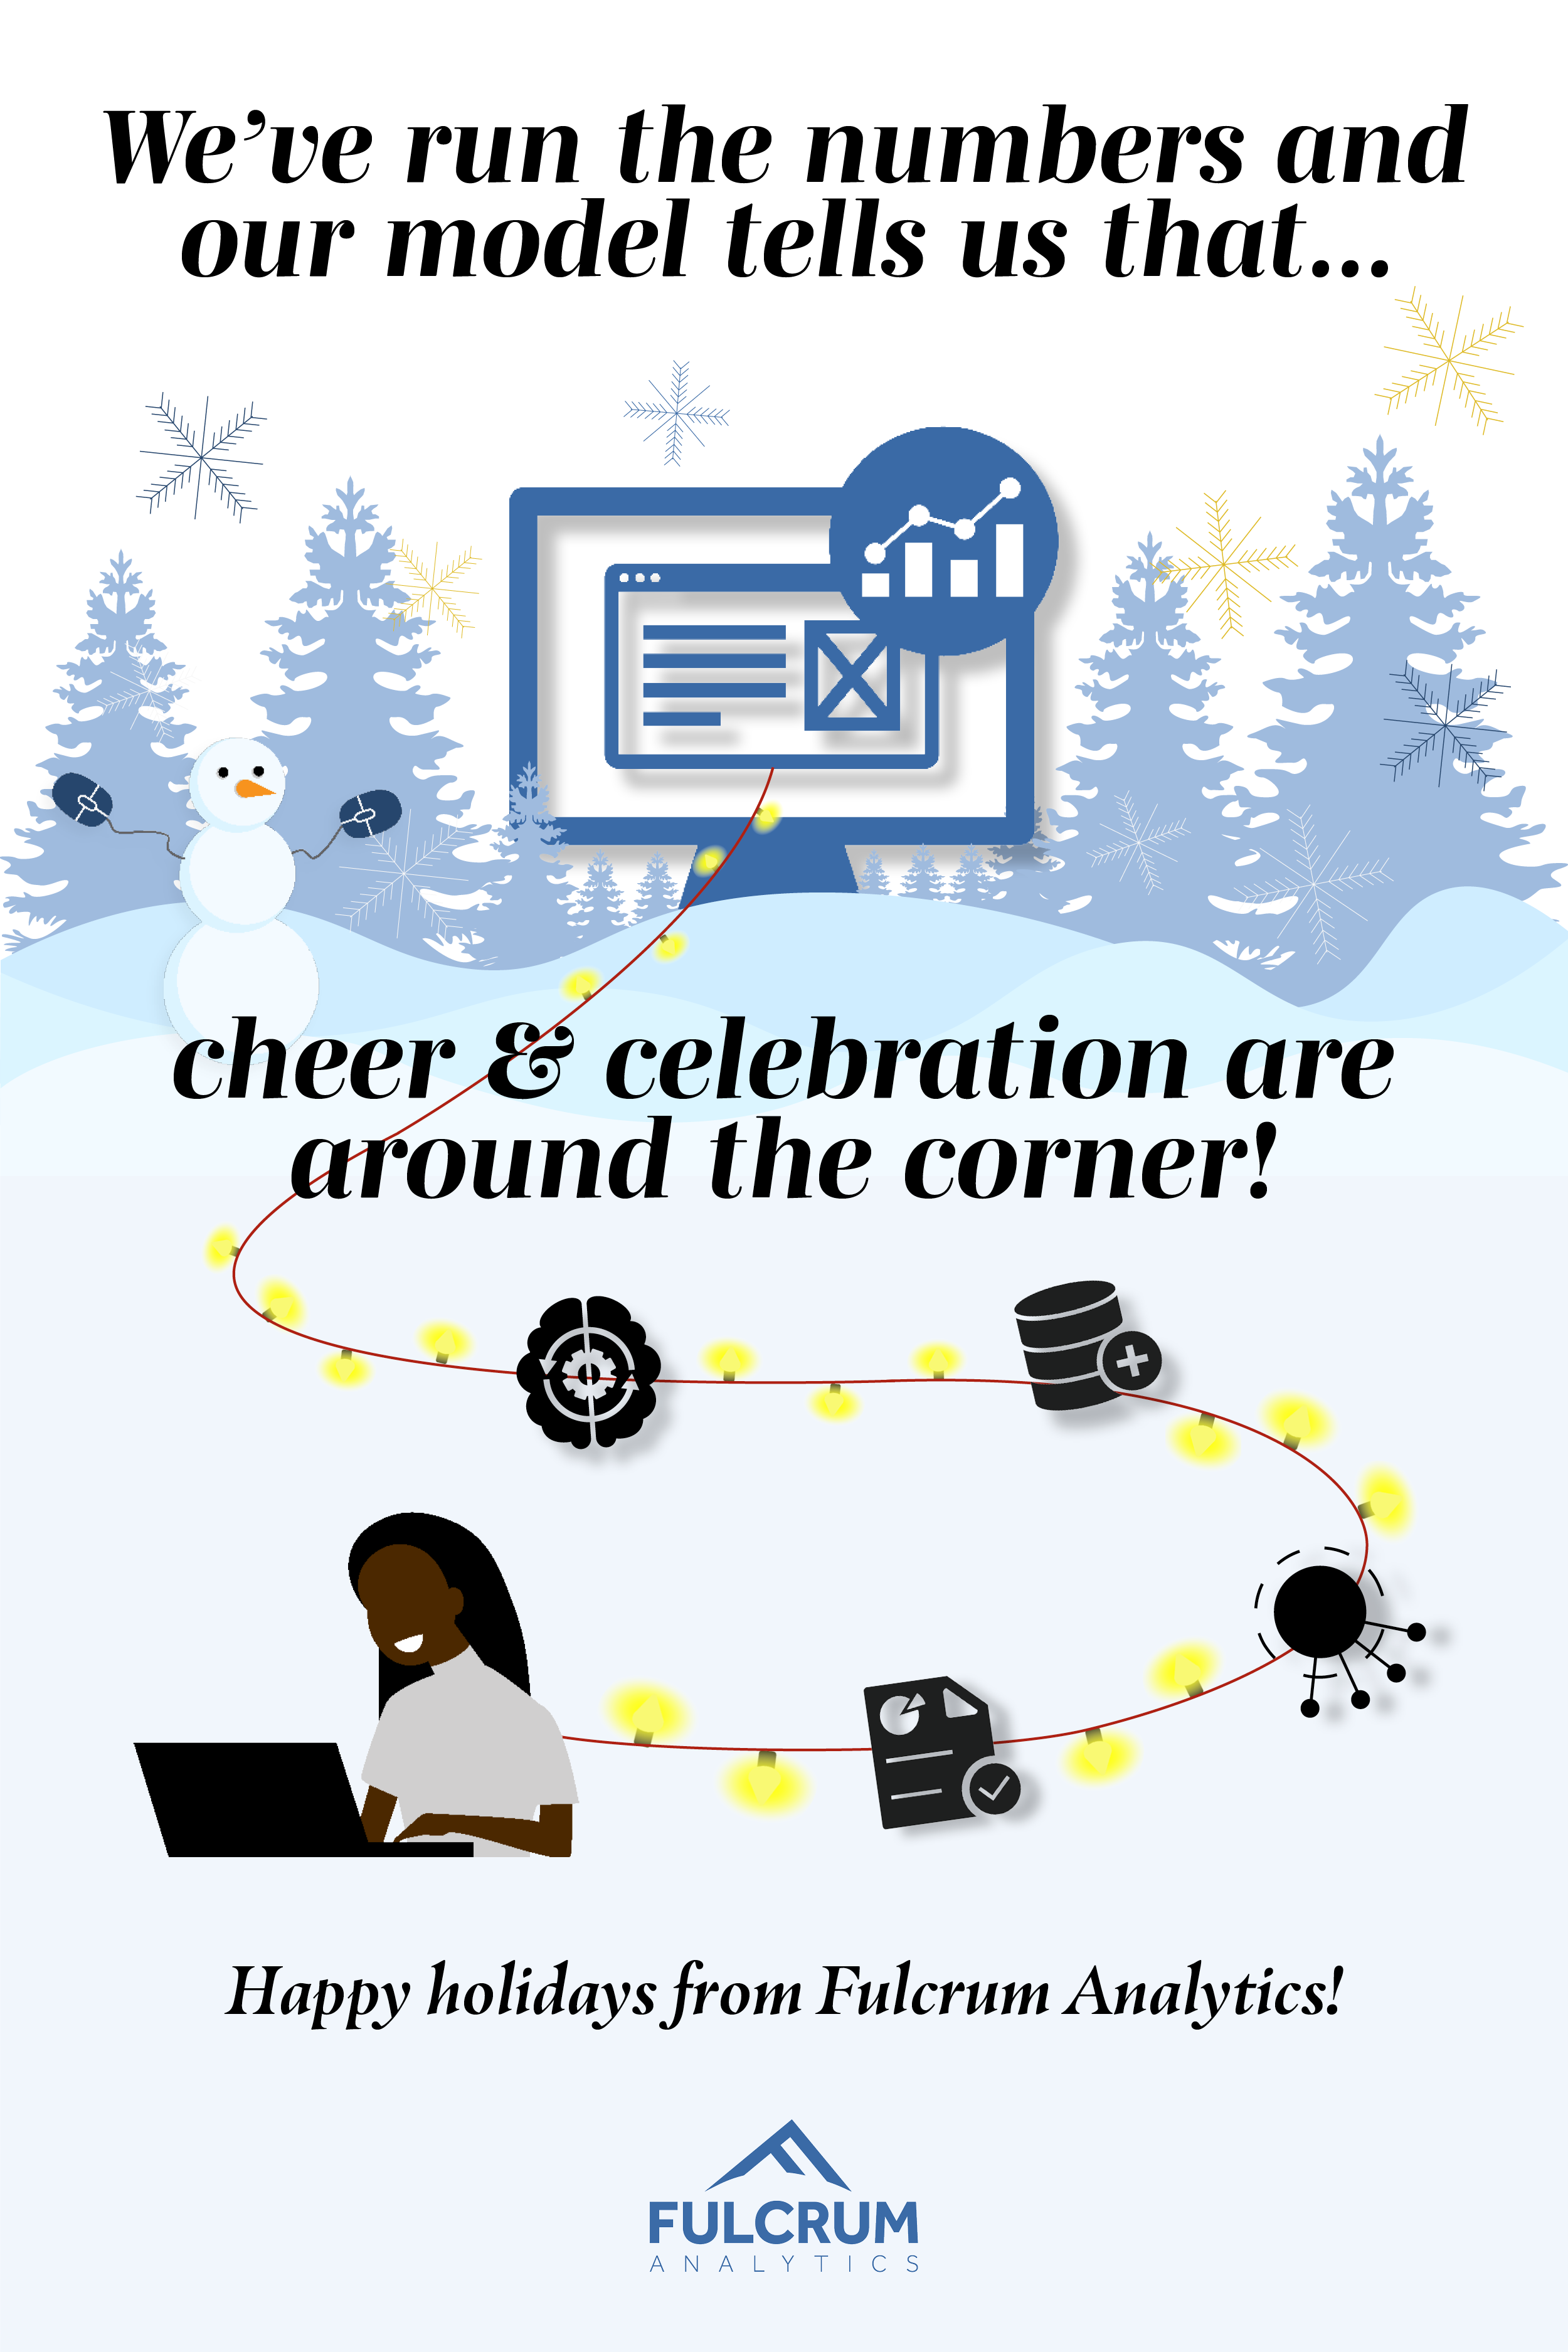
A Festive End-of-Year Holiday Graphic Card with a Storyline for Client Email Marketing
Overview
Storyline Finalization with Marketing Team → Draft Mockups → Iterations → Email Marketing
Method
Graphic Design
Product

Description
For Fulcrum's 2021 holiday card, I created a design that captures the spirit of anticipation during the festive season. The illustration features a desktop computer nestled amidst snow-covered trees, playfully hinting at Fulcrum's unwavering dedication throughout the holidays. A person, symbolizing Fulcrum's data-driven approach, is depicted running analyses on the computer, connected by a network of festive lights – representing the interconnected systems that fuel Fulcrum's success.